TTA Techtra is pleased to offer GEM-based detector set which include:

  1. Front-end readout electronics.
  2. A 100 x 100 mm2 standard detector set compatible with the CERN kits.
  3. Software for controlling the detector, reading data and visualizing the measurement results.

In addition, upon customer’s request, we can extend the system with a High Voltage power supply and gas connections.

The “plug-and-play” detector set from TTA Techtra allows to start R&D work with GEM technology at low cost.

Readout electronics

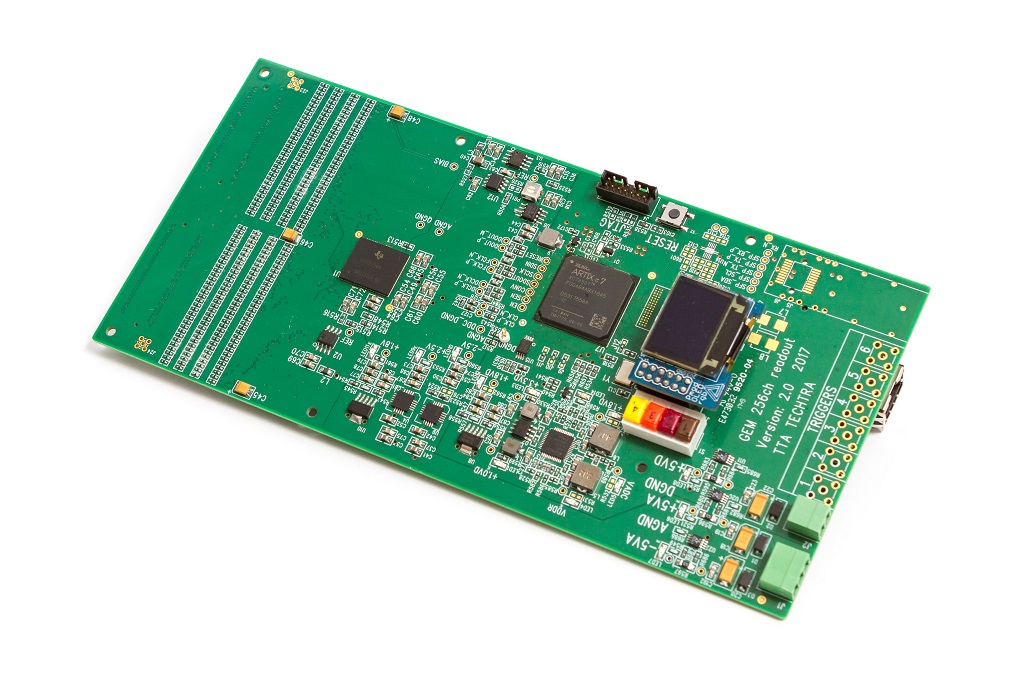
The electronic data acquisition system consists of a power supply, low-noise multi-channel charge-to-digital transducers, an FPGA that processes data and generates clock signals, and an Ethernet interface 100Mbit for communication with a PC computer . Currently, three versions of detectors have been developed: V1.0, V1.1 and the latest V2.0

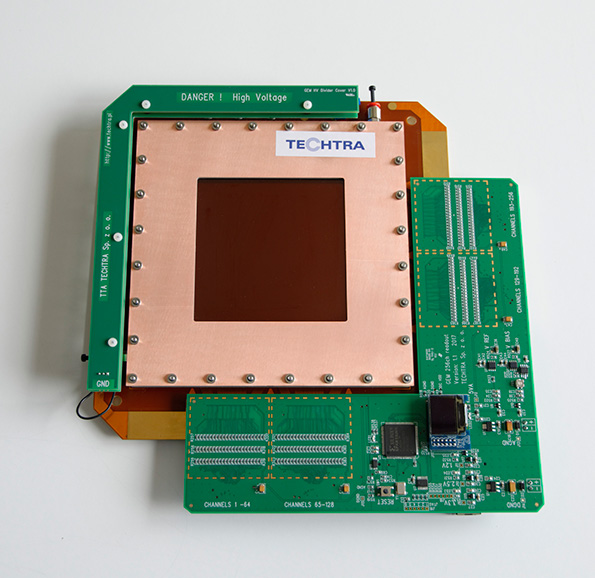
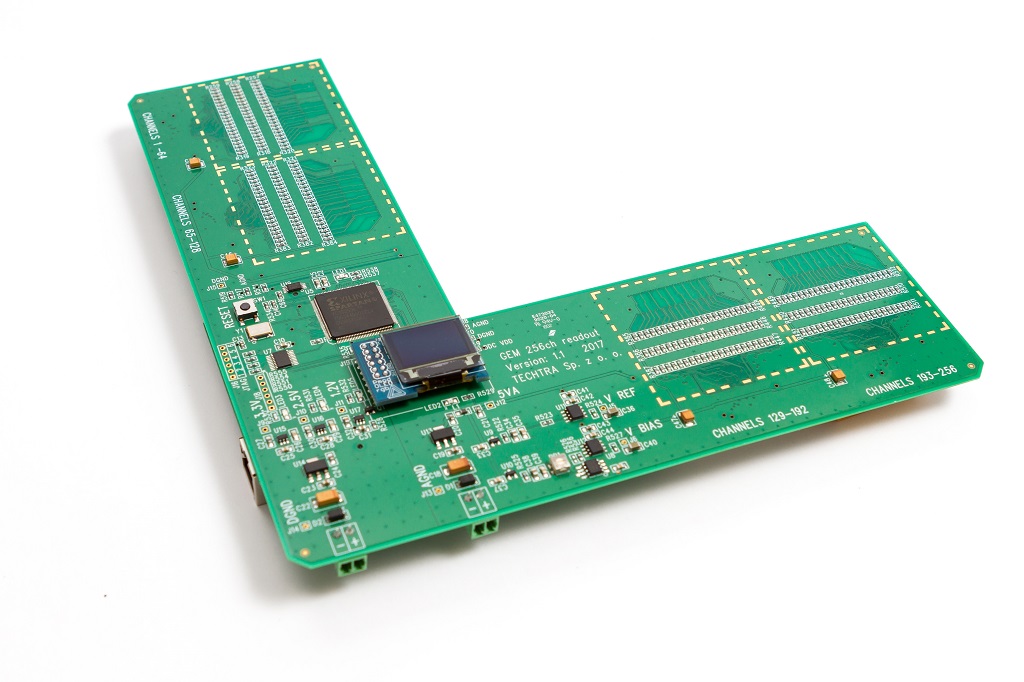
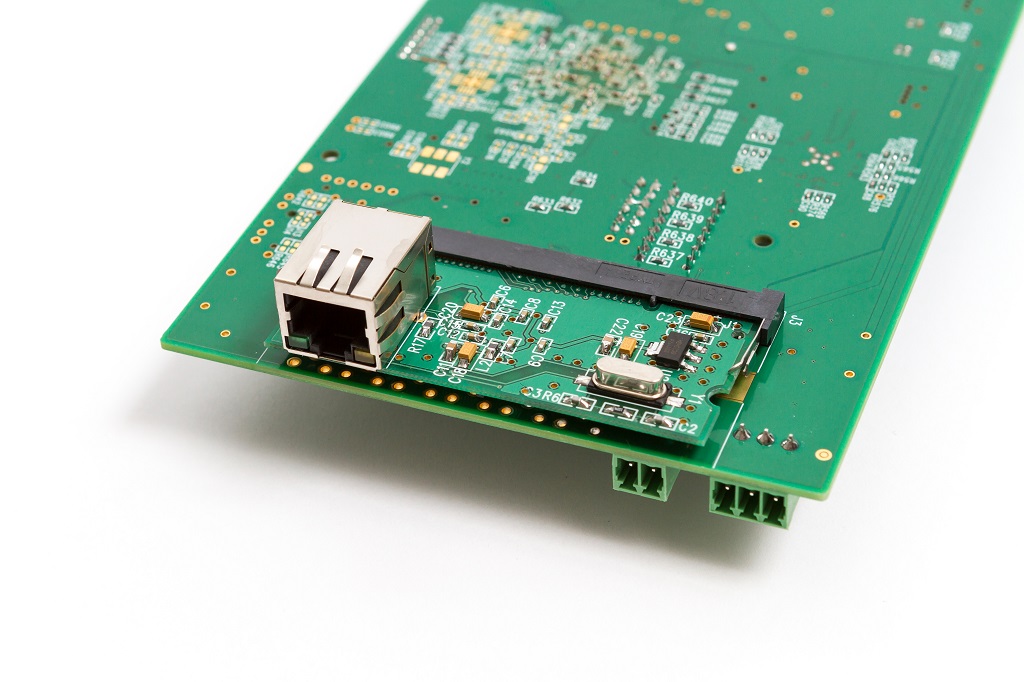
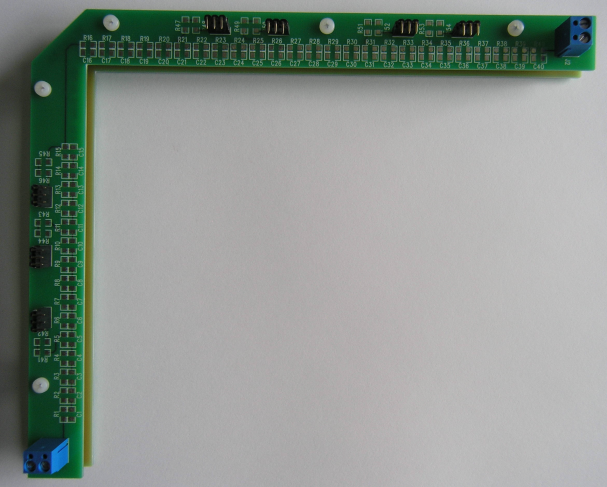
The detectors in versions V1.0 and V1.1 are made with a 4-layer printed circuit in a L-shape. That shape is suitable for GEM detectors with an active area of 100 × 100 mm2 – the detector is directly plugged into X-Y readout strips via Panasonic connectors. Those detectors simultaneous gathers data from 256 channels (128 × 128 strips). The sampling frequency for  V1.0 detector is 4 kHz, while for  V1.1 version it is 6.25 kHz. Both versions works with a resolution of 20 bits. The detectors communicate with the computer via the 100Mbit Ethernet interface. The difference between versions is that the latest one has: a display showing the current status of a detector, measurement parameters and TCP / IP configuration; a digital potentiometer for remote setting of the bias charge of the detector input, and enables faster measurement by using a 16-bit data bus between the FPGA and the Ethernet module. The detector in version V1.1 is shown in Figures 1 and 2.

A detector in version 2.0 is made with a 10-layer, rectangular printed circuit. The design allows connecting multiple measurement boards with one large detector and their mutual synchronization. A single readout system simultaneous gathers data from  256 channels. The V2.0 detector allows sampling at 17 kHz, so it is almost 3 times faster than the V1.1 version. The detector v. 2.0 communicates with a computer via 100Mbit Ethernet interface and it shares the same display showing the current status of the detector, measurement parameters and TCP / IP configuration, a digital potentiometer for remote setting of the bias charge of the detector input with older V1.1. A new solution enables faster measurement by using a 16-bit data bus between the FPGA and the Ethernet module.

The detector in the V2.0 version is shown in figures 3 and 4.

Detector Gas-box and Hardware

TTA Techtra offers assembled and validated GEM detectors compatible with the CERN-made detector kits and pad planes. The detector contains a pad plane (Figure 5), 3 GEM foils, and a drift electrode. The GEM foils have special snap-on connectors which permit GEM foil removal and installation without soldering (Figure 6). We offer dedicated resistive voltage divider plugs onto the readout board to polarize the GEM foils and the drift plane F(igure 7).

To operate, the detector needs a 5kV high voltage power supply and working gas (typically a mixture of Argon and CO2). Compatible power supplies and the gas armature is available separately upon request.

Data acquisition software

The detector hardware is provided with dedicated software for detector control and data acquisition.  The main application is used for starting the detector, setting the working parameters, doing the measurements and to save all data. The data are saved in raw format, which requires further data processing and visualization. The application consists of two windows: the main one with configuration and triggering the measurements (Fig. 8.) and with graphs presenting the current data from the detector (Fig. 9). The software is constantly developed – modifications or additions of new functionalities are possible at the customer’s request.

Data visualization software

Data visualization software is also combined with the detector. This application is dedicated to reconstruct images from data gathered by GEM detector. The program works with collected raw data and processes them to display a final image.  With that software it is also possible to remove  so-called “hot pixels” from the image, plot the energy spectrum of the detected events, filter the energy range that are taken into account during the reconstruction and plot the distribution of events over time. The application consists of four tabs: the main one, on which the reconstructed image is displayed (Fig. 10.), tabs with a graph showing the energy spectrum (Fig. 11.), tabs with a graph of the distribution of the number of events in time (Figure 12), and bookmarks with settings. The software is constantly developed – modifications or additions of new functionalities are possible at the customer’s request.